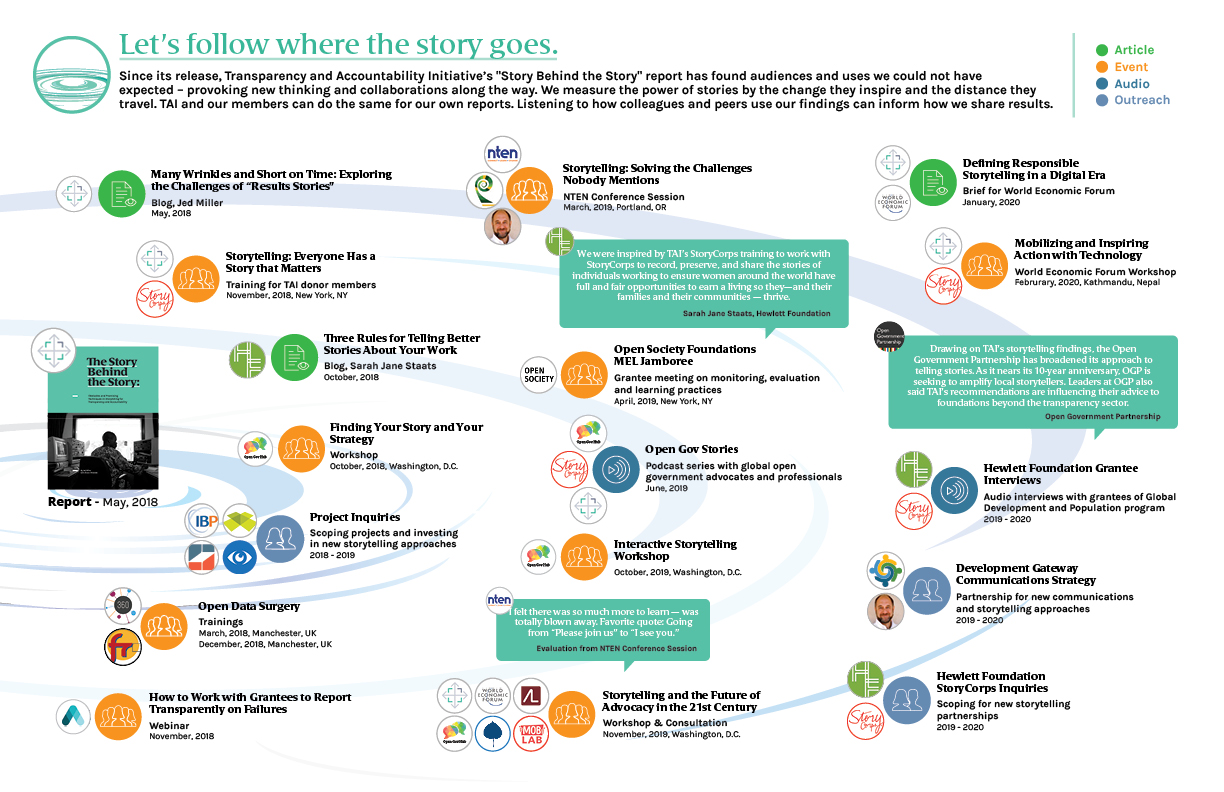
An infographic showing how our stories have travelled
Transparency and Accountability Initiative (TAI) members commission a lot of knowledge products. TAI itself produces a lot. In 2019, we published not just the ever-present TAI Weekly but 60 blogs, 5 reports and a set of collaboration case notes. Yet, how often do we take a step back to see where that knowledge flows? Yes, we may track the number of downloads, but is that enough?
We took our recent Story Behind the Story report and tried to trace where it got taken up and to what effect. What did we find? The report has found audiences and uses we could not have expected; provoking new thinking and collaborations along the way. We’ve attempted to visualize a headline version of how the report was used in this visual. We would love your feedback on this approach.
We measure the power of stories by the change they inspire and the distance they travel. TAI and our members can do the same for our own reports. Listening to how colleagues and peers use our findings can inform how we share results. Investing more in tracking where and how knowledge flows should help us target future knowledge generation and dissemination. Another report or blog in 2020 is not our metric for success. Being able to track how insights influenced others is.


